Using the powerful technology of Gas Discharge Visualization, Bio-Well illustrates the state of a person’s energy field. When a scan is taken, high intensity electrical field stimulates emission of photons and electrons from human skin; powerful imaging technology captures photon emissions given off by each finger. The images are then mapped to different organs and systems of the body, tapping into Chinese energy meridians. The images created using the Bio-Well system are based on the ideas of Traditional Chinese Medicine . This concept was first proposed by Dr. Reinhold Voll in Germany, later further developed by Dr. Peter Mandel, and then clinically verified and corrected through 18 years of clinical research by a team led by Dr. Konstantin Korotkov in St. Petersburg Russia.
Bio-Well utilizes a weak, completely painless electrical current applied to the fingertips for less than a millisecond. The body’s response to this stimulus is the formation of a variation of an “electron cloud” composed of light energy photons. The electronic “glow” of this discharge (invisible to the human eye) is captured by an optical CCD camera system and then translated into a digital computer file. The data from each test is converted to a unique “Photonic Profile”, which is compared to the database of hundreds of thousands of data records using 55 distinct parametric discriminates, and charted so that it is available for discussion and analysis. A graph of the findings is presented as a two-dimensional image. To study these images, fractal, matrix, and various algorithmic techniques are linked and analyzed.
FEATURES and BENEFITS
Features
The scanning process is quick, easy and non-intrusive… do it daily for best results!
A powerful tool that provides you with a wealth of rich data to help identify areas to tend to as you work towards personal coherence
Get real time feedback on what factors – positive and negative –affect your energy state
System provides instant graphic representations of the data to provide easy reference and interpretation.
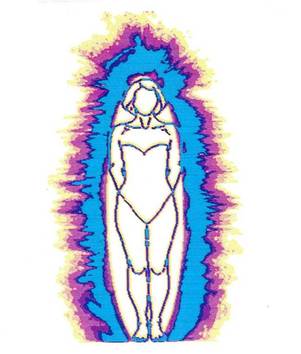
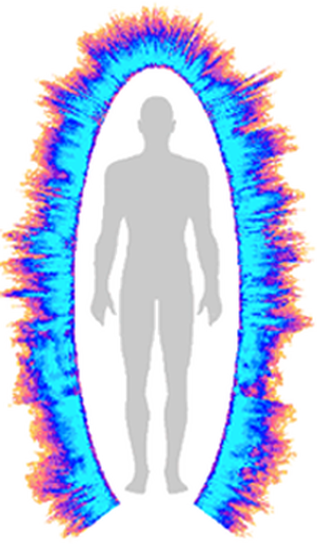
Displays data in an easily understood format using graphic representations; placing indicators within the outline of the human form for ease of discussion
View each scan in a variety of interesting ways with up to seven result display options
Save or print a report containing all data points of each scan
Save or print your results with one click
With the Sputnik and Bio-Well Accessory Pack add-ons, measure environment and the affect of objects on your energy too!
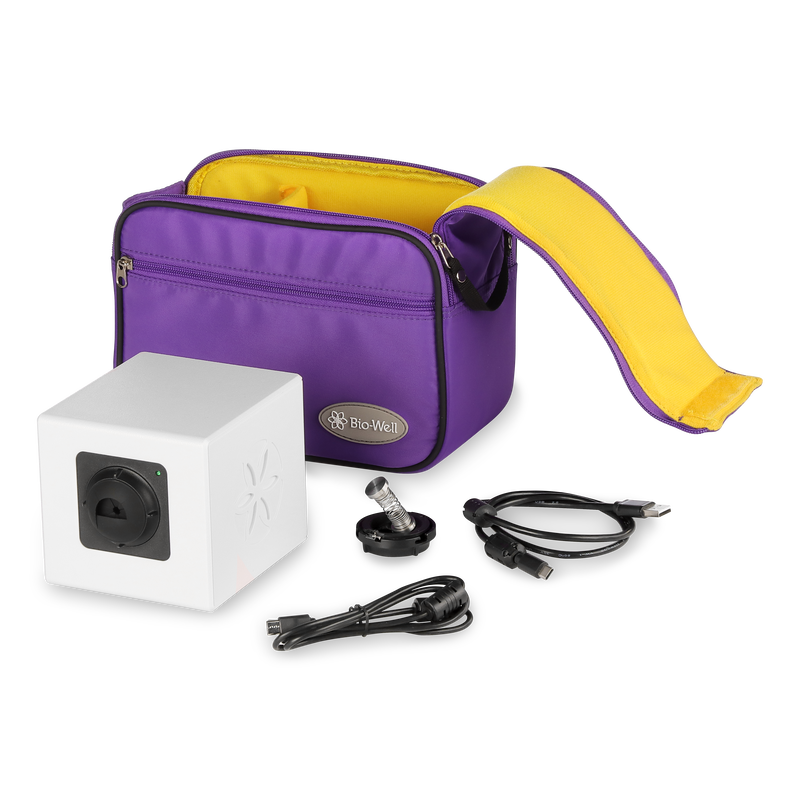
State-of-the-art, sleek camera that doesn’t require a power source. It simply connects to your computer with USB-cable (included)
Conduct scans, view results and access previous scans through the sophisticated Bio-Well accompanying software
Monitor your energy state throughout time in order to track your responses to physical and mental exercises, response to weather changes, different loading
Monitor the energy history of your family and friends
Customize your experience by only paying for the scan types and data views you need with three subscription level options
Store historical scans for as long as you’re a subscriber
Disclaimer: This site or Bio-Well technology is not intended to treat, diagnose or prescribe. The information contained herein is in no way to be considered as a substitute for consultation with a duly licensed health care practitioner.